


Patapsco Valley 50k over the last eleven years
Race trends and an analysis of the data

Intro
The Patapsco Valley 50k has been held annually on the third or fourth Saturday in October since its inaugural run on October 25, 2014. My first time running the race was this year, and I thoroughly enjoyed it. Since Carl Morris came out with the Trail Ultra Project, I’ve been wanting to do some of my own studying and analysis of ultra race data, and choosing Patapsco Valley 50k as a race to study—local to me and with a manageable amount of data—made sense. This analysis reviews only the in-person race data for Patapsco Valley 50k, excluding all virtual entries. I pulled data from the UltraSignup website for the race. Using Google Sheets and Stata, I look at participation trends for the race, the relationship between finishing times and temperature on race day, and the relationship between finishing times and age of the runner.
Participation trends
Registration numbers for Patapsco Valley 50k have fluctuated quite a bit over the years, for various reasons. While the race did see a growth trend from 2014-2017 in both the number of registrants and actual number of runners, this trend has not maintained.

In 2018 due to weather and state policies, the race was moved from Patapsco trails to the BWI "trail," a 10.5mi road loop that was run 3x for runners to hit 50k, and as a result a lower overall percentage of registrants actually ran, only 57.1% (n=182), compared to much higher percentages for other years (mid-80s typically). According to Barb Meely, this change from the planned route at Patapsco to the BWI road loop was made on Friday morning Oct 26, 2018, roughly 24 hours before the race start.1 Numbers were down in 2020 likely due to the COVID-19 pandemic, but since then numbers have come back up, leveling out a bit in the last two years.
Unfortunately, the race data seems patchy in some areas. The category for disqualified finishers was only used once, in 2016, after which the category of unofficial finishes was applied. No DNSs were reported in 2020, and neither DNSs or DNFs were reported in 2021. I spoke to race director Mario Raymond who said that after 2020 very few DNFs were reported because the virtual 50k option was made available in 2020. If a runner didn’t finish the event on race day, the race directors automatically moved their entry to the virtual 50k on UltraSignup so they could still earn their finisher’s prize (a handmade mug) if they wanted.
Data by numbers

Data by percentages

Percentages by finish category
From Stata, I pulled the percentage of registrants by finish category, i.e., DIS = disqualified, DNF = did not finish, DNS = did not start, FIN = finished, and UNF = unofficial finish. Throughout the race’s history, 81.10% of registrants finished the race, 12.86% never started, and 4.96% DNFed.

Registrants by gender
A quick look at registrants by gender shows that Patapsco Valley 50k has had twice as many male registrants as female registrants.

Temperature and finishing time
Temperatures in late October are variable from year to year as the last vestiges of late summer warmth shake off and fall comes into full swing. Temperature has a significant impact on the performance of ultra runners, reflected in the graph below, which shows a correlation between the top results of male and female runners plotted against the daily high temperature for the greater Baltimore area collected by the BWI Airport weather station.2 As the high temperature on race day fluctuates, so does the running time of the top runners.

The record finishing time of 3:43:43 for the Patapsco Valley 50k, set by Zachary Schroeder in 2018, was set on the race day with the lowest daily high temperature from 2014-2024, which was 51°F on October 27, 2018. Granted, this time was set on the BWI trail, not the Patapsco Valley State Park 25k course loop. The PV50k record time for the 25k course loop is 3:57:12, set by David Mckay in 2016, which was the third coldest day in the history of the race, with a high temperature of 59°F, just 1°F warmer than the second coldest day in the history of the race.3
One anomaly in the data is 2020, for which the top male and female results among entrants did not drop as much as expected given the daily high temperature of 77°F. However, this can be explained by the fact that the 2020 race started earlier than other years, with waves of runners going out starting at 6:15 AM, whereas the race started at 7:00 AM or 7:30 AM most other years.4 This gave the 2020 runners more time to run in the cool early hours of the day, avoiding the hottest part of the day, with the temperature on October 24, 2020, peaking around 1:00 PM.
Seeking to strengthen the evidence of a relationship between finishing time and temperature, I ran several simple linear regressions in Stata, using finishing time in minutes for the dependent variable and the high temperature on race day as the independent variable.
Regression 1: Finishing time and temperature, all finishers by gender
First, I ran a regression on finishing time and temperature for all finishers. Here is the output:

Interpreting this, for every 1°F increase in temperature, 2.91 minutes (2 minutes 55 seconds) are added to the finish time for male finishers of all ages, on average (statistically significant, p<0.0001). The R-squared value indicates that the model explains just 6.22% of the variation in finishing times, suggesting that factors other than temperature influence finishing time.

For female runners of all ages, on average, for every 1°F increase in temperature, 2.95 minutes (2 minutes 57 seconds) are added to the finish time (statistically significant, p<0.0001). The model explains just 7.17% of the variation in finishing times. This is almost exactly the same as the result for male runners, i.e., temperature affects men and women about the same, with an almost identical increase in time to finish for each incremental increase in high temperature on race day.
Regression 2: Finishing time and temperature, top twenty finishers by gender
To see how the effect would change if I narrowed this to just the top performers, I ran a regression on just the top twenty finishers by gender. Here is the Stata output:

Interpreting this, for every 1°F increase in temperature, 2.94 minutes (2 minutes 56 seconds) are added to the finish time for male finishers, on average (statistically significant, p<0.0001). Excitingly, the model fit is much better when just the top twenty finishers are analyzed. The R-squared value indicates that the model explains 33.16% of the variation in finishing times, which is remarkable given what can impact race performance.

The regression for female finishers is very similar but the effect is smaller: for every 1°F increase in temperature, 2.71 minutes (2 minutes 43 seconds) are added to the finish time for female finishers, on average (statistically significant, p<0.0001). The R-squared value indicates that the model explains just 18.76% of the variation in finishing times. This could mean that female runners are more resilient to temperature (smaller effect), that other variables impact a female runners’ performance (smaller R-squared value), or some combination of both. This analysis is too narrow to determine exactly what these numbers mean.
Age and finishing time
Just as there is a demonstrable relationship between temperature on race day and the finishing time of runners, I ran linear regressions to see if there is a relationship between age and finishing time. The age of PV50k runners across the years ranges from 17 to 75 years old.
Regression 1: Runner age and minutes to finish the race
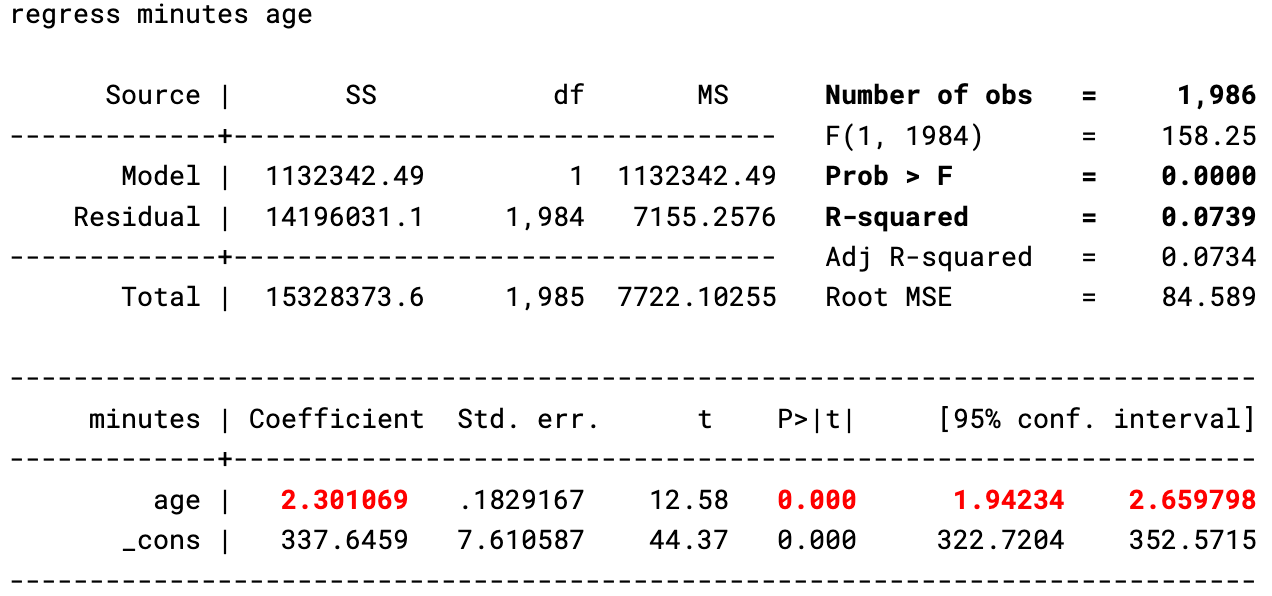
This regression shows a statistically significant relationship (p<0.0001) between age and finishing time in minutes: each additional year of age is associated with an increase of 2.30 minutes in race time, on average across all runners. While this relationship is significant, it explains only 7.39% of variability in race time. In this model, the predicted race time for a finisher with an age of 0 (not a meaningful scenario in this context) is approximately 337.65 minutes. This value serves as the baseline for extrapolating the model.
Two thoughts occurred to me here. First, it might be more meaningful to predict the relationship between finishing time and age by comparing the performance of runners against the highest-performing age group, on average, than by extrapolating from a baseline age of 0. Second, it’s misleading to say that with each additional year of age, a runner finishes 2-3 minutes slower (implying that younger runners are always faster). I expect the highest performing ages to be roughly 25-35. Said another way, the fastest runners aren’t necessarily the 17- and 18-year-olds, and the 2.3 minute/year increase in finishing time is not likely to be evenly distributed across the age spread. To address these items, I ran the regression using age groups.
Regression 2: Runner age (by group) and minutes to finish the race
For a more meaningful expression of the relationship between age and finishing time, I broke down age into seven groups: 10-19, 20-29, 30-39, 40-49, 50-59, 60-69, and 70-79. Here is my Stata output, using 20-29 as the reference group:
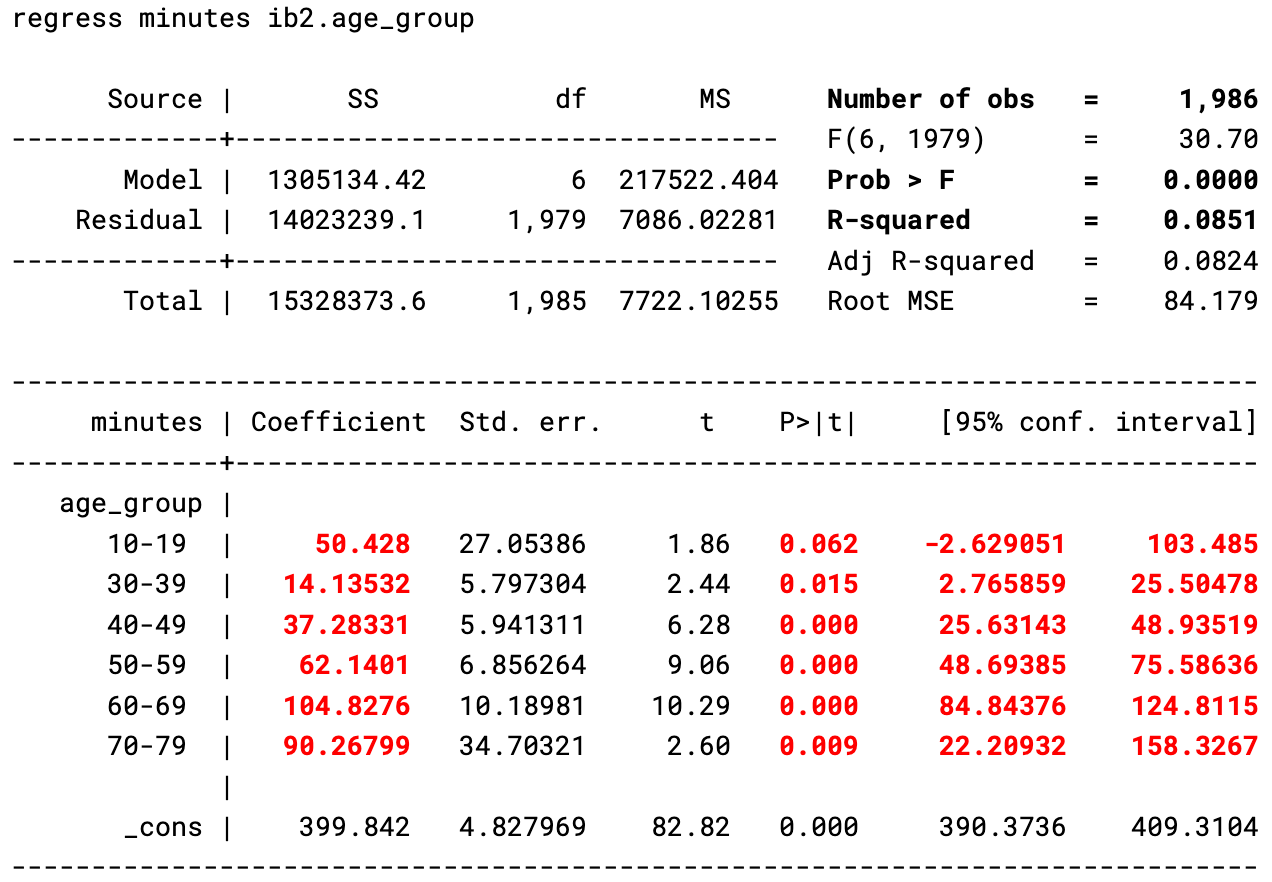
Here is how the coefficients can be interpreted, representing how the race times of each age group, on average, compare to the 20-29 group:
Ages 10-19: Finish 50.43 minutes slower than the 20-29 group (marginally significant, p=0.062)
Ages 30-39: Finish 14.14 minutes slower than the 20-29 group (statistically significant, p=0.015)
Ages 40-49: Finish 37.28 minutes slower than the 20-29 group (highly significant, p<0.0001)
Ages 50-59: Finish 62.14 minutes slower than the 20-29 group (highly significant, p<0.0001)
Ages 60-69: Finish 104.83 minutes slower than the 20-29 group (highly significant, p<0.0001)
Ages 70-79: Finish 90.27 minutes slower than the 20-29 group (statistically significant, p=0.009)
The average race time for the 20-29 age group is approximately 399.84 minutes. The R-squared value indicates that the model explains 8.51% of the variation in race times, suggesting other factors influence race times beyond age (expected). The F-statistic indicates that the model is statistically significant (p<0.0001), meaning that the age groups explain some amount of race time variation. The smallest difference in finishing times from the reference group is shown for the age group 30-39.
Conclusion
I offer three takeaways. First, the Patapsco Valley 50k has enjoyed healthy participation from 200-225 registrants annually with a finish rate >80%, fairly standard for the 50k ultra distance. Second, temperature on race day is a statistically significant predictor of finishing time, increasing overall finish time by roughly 30 minutes per 10°F increase in temperature. Third, age is also a statistically significant predictor of finishing time, with runners ages 20-29 finishing faster, on average, than other age groups, and runners ages 30-39 and 40-49 not far behind. There are a host of things that can impact someone’s race performance: prior experience running ultras, physical fitness and training, health and genetics, nutrition and hydration, mental resilience and motivation, pacing strategy, environmental factors, community support, and the design of the race itself. This analysis is very narrow in its scope, with no assessment of and controlling for other important variables, and should not be interpreted as having definitive authority of what determines how an ultra runner will perform on race day.
And, as promised, a shortlist of media I’m consuming this week:
Arcane, Season 2, and any video essay on the show I came across on YouTube
“Psychology,” album by Pigeons Playing Ping Pong
Brave New World by Aldous Huxley
This conversation by Vlad Vexler on the psychology of Elon Musk, YouTube link here
Baltimore Museum of Art, Baltimore, Maryland